4.1 Performance
The SINGLE datapath is evaluated in RTL simulation with a 4 ns period. Throughput and AllReduce response use two ranks on separate ports; final-contribution latency uses eight ranks on one full-duplex port. These first four sections use the two-port core with both arithmetic paths; the last section repeats the rate measurements on the released one-port U280 profile.
DATA throughput
With 4096 elements per rank and Kulisch accumulation, INT8 reaches 13.65 billion elements/s per port, compared with 3.26 billion for FP32. The element rates reflect the number of values packed into each beat at similar numeric bit rates.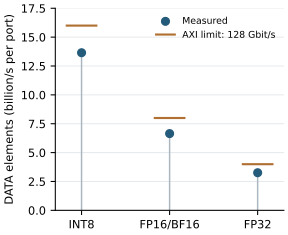
RESULT throughput
For the same FP32 inputs, the aggregate frame rate reaches 110.5 Gbit/s with AUTO, 121.5 Gbit/s with FP32 output, and 124.3 Gbit/s with Kulisch output. Packetization and format selection contribute to the difference. A higher frame-byte rate does not by itself imply less traffic for a collective: that comparison is made on the traffic page.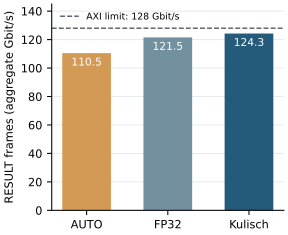
AllReduce response
Response time includes setup and runs from the first STAGE transmission to the last RESULT beat accepted by the last destination. Setup stays at 141 cycles. With Kulisch, total time grows from 196 cycles at 64 elements to 673 at 4096; FP32_ARRIVAL takes 203 and 683 cycles. At 4096 elements, these correspond to 2.69 µs and 2.73 µs at the assumed 4 ns period.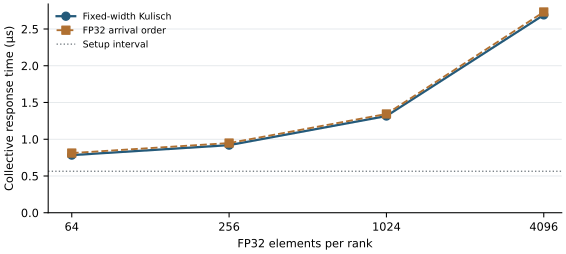
Final-contribution latency
Here the first seven contributions are already present. The measured interval starts at the last accepted DATA beat of the eighth contribution and ends at the first accepted outgoing RESULT beat.
For FP32 inputs, Kulisch takes 152 ns at 64 elements and 200 ns at 256; FP32_ARRIVAL takes 160 ns and 304 ns. Kulisch accumulation emits Kulisch values, while FP32 accumulation emits FP32 values. Repeating the preload with 128 and 256 idle cycles gives the same measured latencies.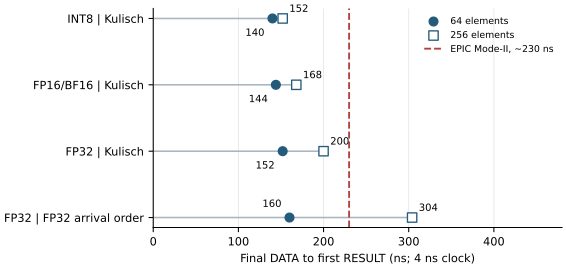
EPIC's FPGA study reports that reference for eight FP32 ranks on Agilex. The missing measurement details and different platform limit it to contextual comparison.
Line rate of the U280 profile
The released build has one port, 280-bit Kulisch in four exact banks, and no FP32 path. Its requirement is at least 100 Gbit/s on every input and output, measured per stream from the first to the last accepted beat. The test runs two ranks on one port with 4096 elements each, for all 24 pairs of four input formats and six output policies, and checks every value.
- DATA payload: 103.70 Gbit/s for INT8, 102.08 for FP16/BF16, and 100.98 for FP32, which needs the most frames and pays about four admission cycles per frame.
- RESULT payload: 122.27 Gbit/s for native and AUTO results, 121.26 for Kulisch, whatever the input format.
- AUTO with a few exact values among INT8 results, the hardest output case: 103.97–126.18 Gbit/s of frame bytes over eight tiles. The slowest, with exact values at lanes 16, 32 and 63, is the worst tile an exhaustive search found among tiles with up to four exact values.
A 100 GbE link carries at most 98.4 Gbit/s of frame bytes with 1514-byte frames, so the core outpaces its port in every measured case. The figures are copied from the thesis evaluation assets. Throughput uses the Kulisch runs in 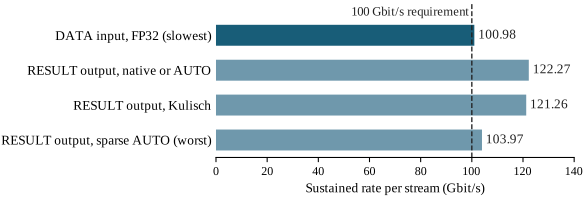
Evidence sources
experiments/02-experiment-numbergroup-single/results/evaluation-cycle-exact.csv. Response and final-contribution figures use the online-arrival runs under build/experiments/fp32-arrival-online/, with the latency source record in the thesis asset final_contribution_latency_8rank_sources.json. U280 profile rates come from the regression of commit 812a183, suites rtl-u280-profile and rtl-result-wide-target; the values and the plotting script are in experiments/05-experiment-u280-release/.
On-board performance and longer or multi-switch collectives require further measurements.