Inspect PRISM traffic with Wireshark
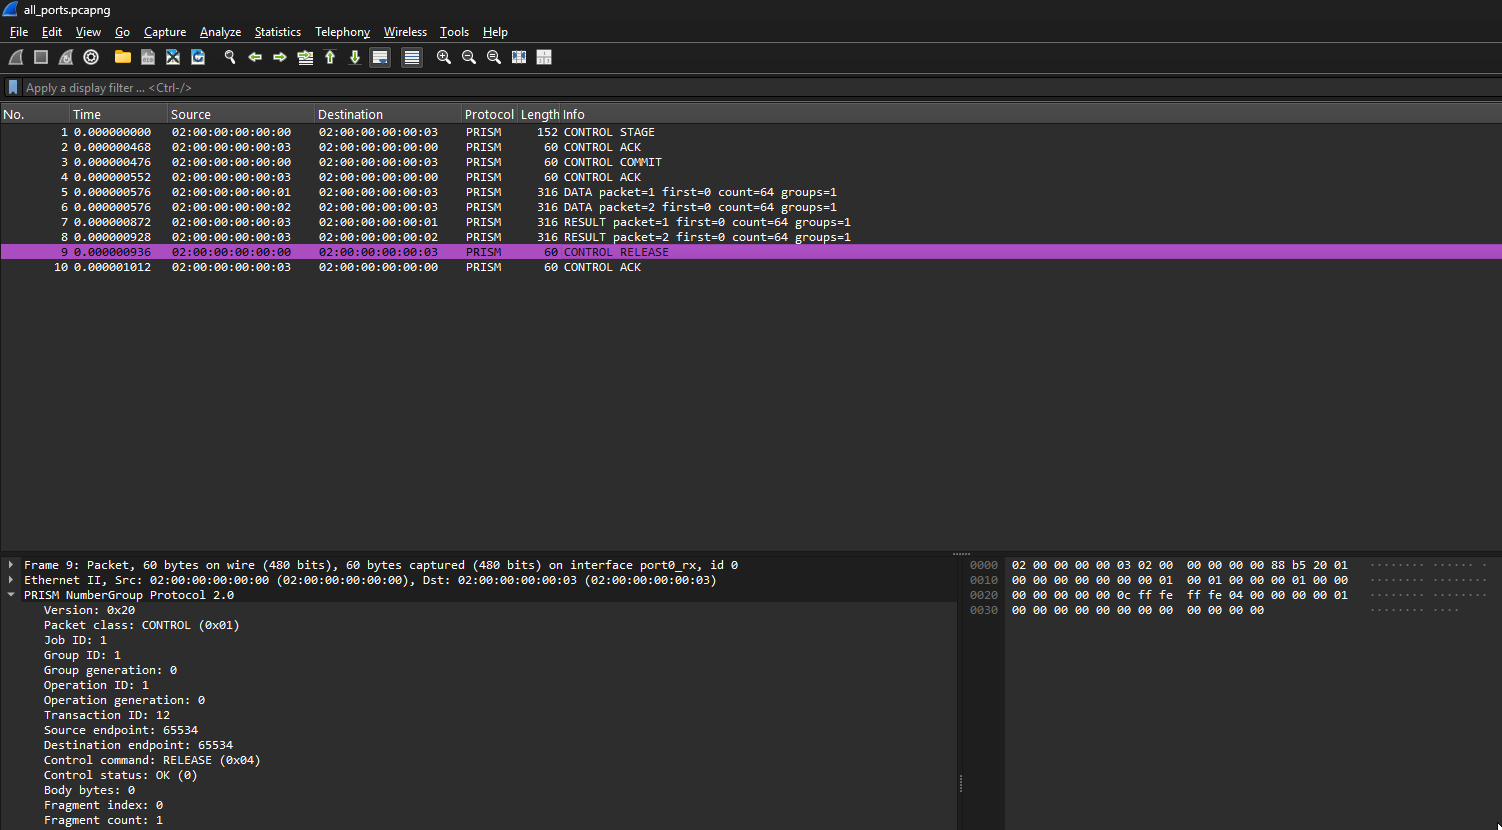
PRISM includes the Lua dissector repo/prism-ccl/wireshark/prism.lua for the current version 2.0 wire format. It decodes CONTROL, DATA, RESULT, and PROGRESS headers and DATA/RESULT NumberGroups. Display filters use prism.*; no custom Wireshark build is required.
Installation guide
Copy repo/prism-ccl/wireshark/prism.lua into your personal Lua plugin folder, creating it if necessary.
- Windows:
%APPDATA%\Wireshark\plugins - Linux and macOS:
~/.local/lib/wireshark/plugins
Reload the plugin with Analyze → Reload Lua Plugins (Ctrl+Shift+L) or restart Wireshark. The exact folder in use is shown under Help → About Wireshark → Folders → Personal Lua Plugins.
Inspect a capture
The SINGLE RTL experiment can produce one with make experiment EXP=02-experiment-numbergroup-single ARGS="collect --capture-pcaps". It writes per-port PCAPs and a timestamp-ordered all_ports.pcapng under the run's captures/<policy>/ directory. On the host of a U280, capture the card's traffic with sudo tcpdump -i <interface> -w capture.pcap ether proto 0x88b5.
Open a PRISM capture and filter with prism.opcode == 0x02 for DATA or prism.group.format == 0x80 for Kulisch NumberGroups. The dissector obtains the Kulisch width from an observed CONTROL STAGE; if that frame is absent, set Fallback Kulisch width in the plugin preferences to the operation's configured width. Group values are displayed as bytes. Use prism.flags.accumulation_inexact == 1 to find a terminal arithmetic error.